Suicides by regions
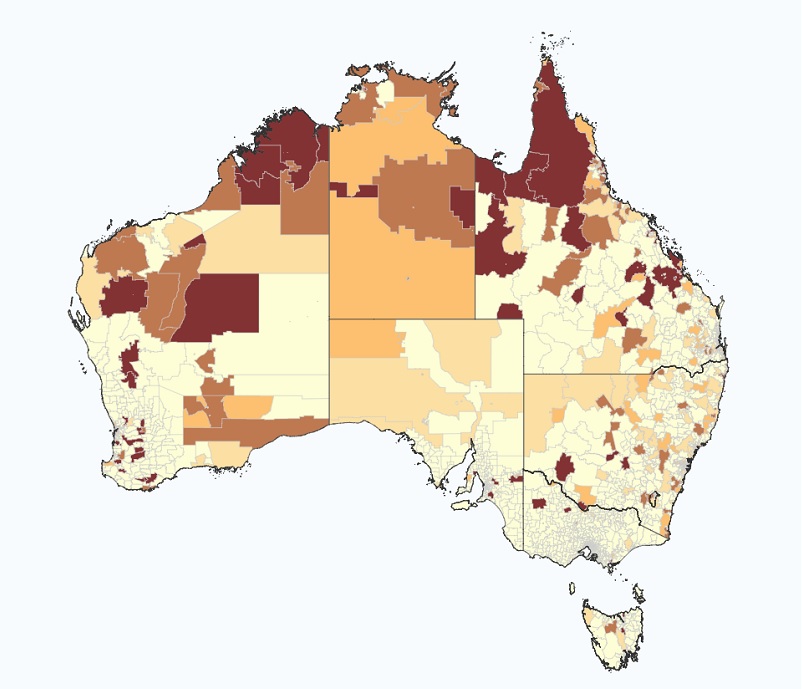
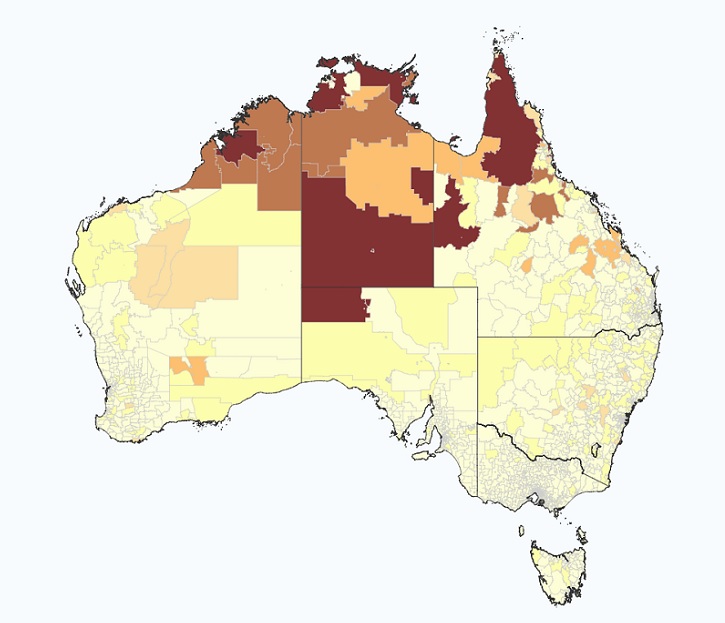
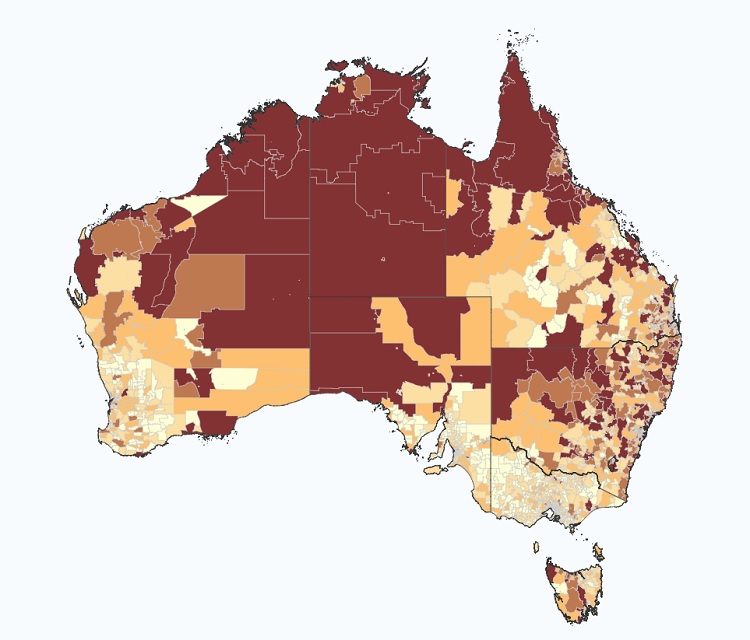
The following maps provide a visual insight into how the number and rate of Indigenous suicides varies across different regions of Australia.

The following maps produced for ATSISPEP provide a visual insight into how the number and rate of Indigenous suicides varies across different regions of Australia.
Cautions and caveats
In general, caution should be exercised when interpreting Indigenous suicide data, particularly trends over time and data for smaller geographic areas.
The maps presented on this page use data from the National Coronial Information System (NCIS). The data from the NCIS provide the best available picture of suicide in Australian states and territories, although there are difficulties in establishing conclusively the number of Indigenous suicides. This is because a significant number of suicides are classified as having an 'unknown' Indigenous origin. As a result, while the statistics presented here highlight that Indigenous suicide is a significant public health issue, they are likely to underestimate the true scale of suicide in Indigenous populations.
The under-identification of Indigenous suicide is of particular concern in Victoria and South Australia. Deaths with 'unknown' Indigenous status accounted for around 30% of suicide in Victoria and over 70% in South Australia from 2001 to 2012. The information provided in the maps for the geographic areas (postcodes) within these states may be too unreliable for general use and should be treated with extreme caution. Data for these 2 states have been included in an attempt to provide a complete picture of available suicide data across Australia.
In addition, there are challenges in estimating the size and structure of the Indigenous population. Population figures are used to calculate suicide rates and the quality of the population data has direct implications for the validity and reliability of Indigenous suicide rates. Map 2 includes rates that have been calculated using the 2006 Census of Population and Housing. The census has been used because it provides population data at a postcode level, however, it has shortcomings with regard to obtaining an accurate count of the Indigenous population, e.g. it typically under-counts the population and there is missing information on Indigenous status. These shortcomings can be significantly amplified in some regions of Australia.
Interpreting small area data
Given the data concerns outlined above, the maps on this page should be interpreted with caution. They are designed to highlight: the distribution of Indigenous suicide across Australia; areas with relatively high Indigenous suicide rates; and provide insights into potential hotspots of Indigenous suicide between 2001 and 2012.
The 3 maps provide data by postcode and should be considered collectively to obtain an adequate understanding of the problem across the country. Map 1 provides suicide numbers; Map 2 shows suicide rates; and Map 3 contains the Indigenous population size. Map 3 has been included to provide context to areas with high/low suicide numbers and rates.


