Suicide trends
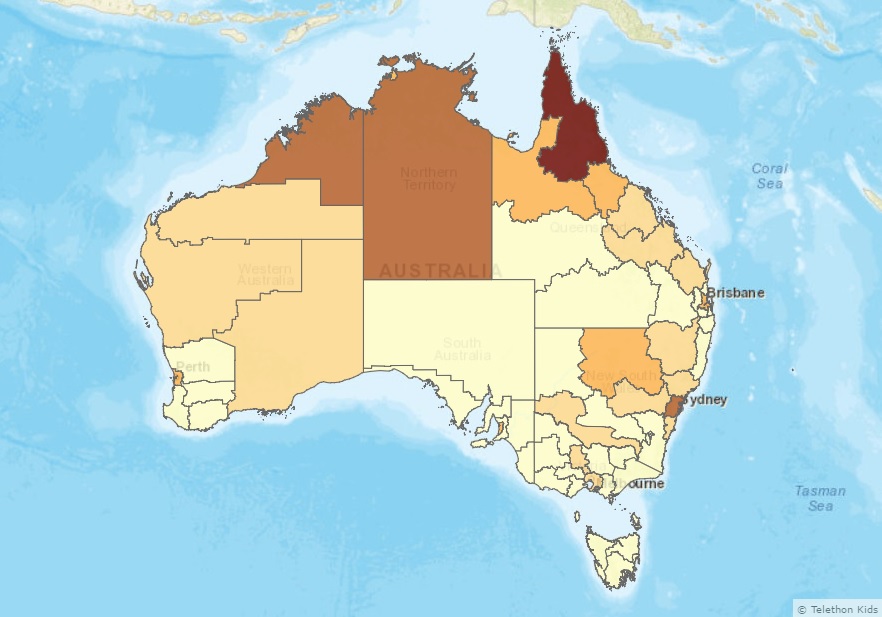
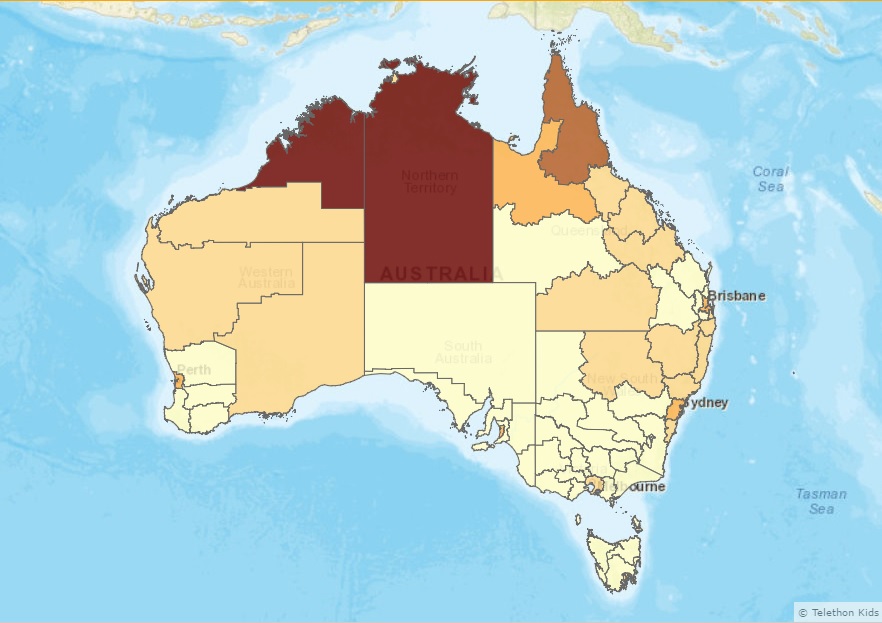
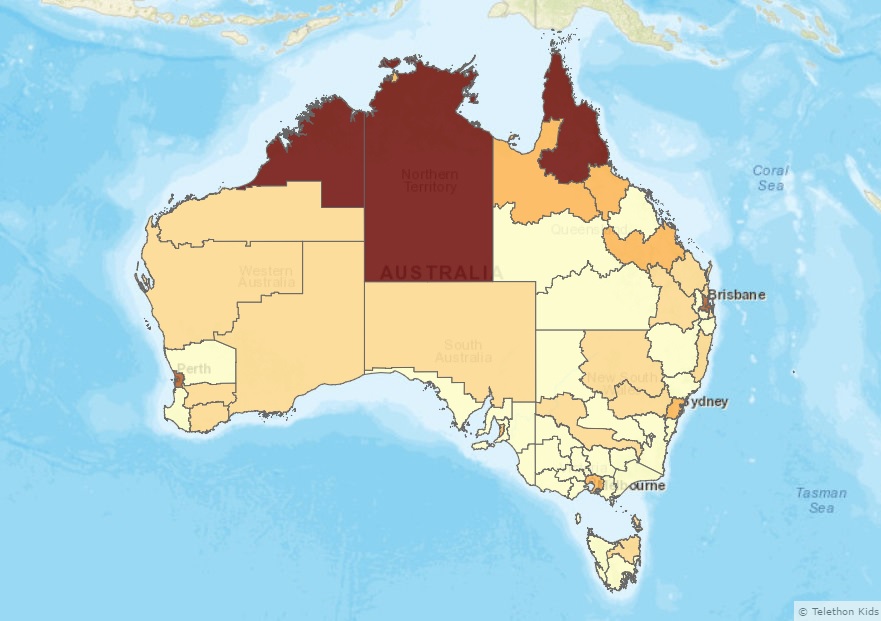
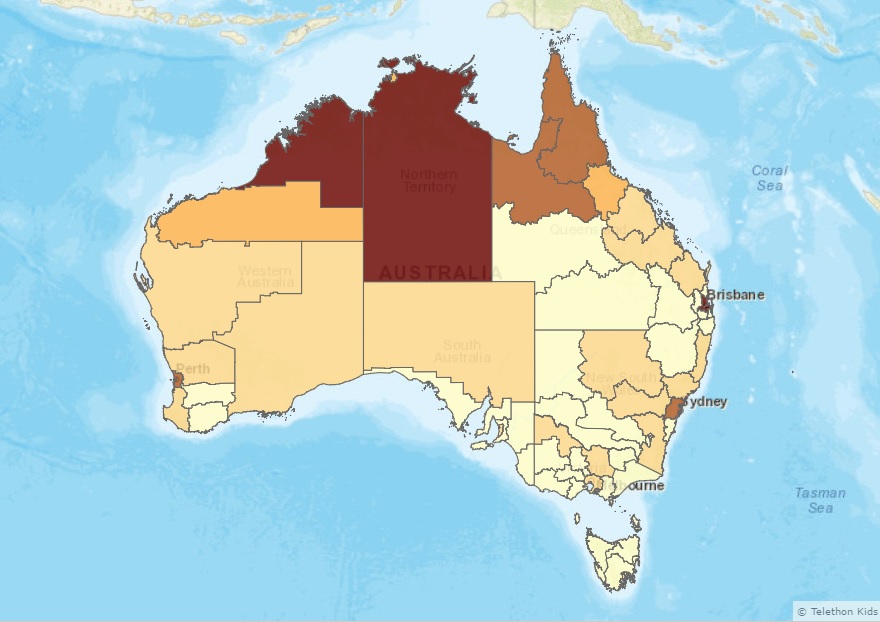
The following maps highlight the Indigenous suicide rate trends over time (from 2001 to 2012) in different regions of Australia.

The following maps highlight the Indigenous suicide rate trends over time (from 2001 to 2012) in different regions of Australia.
Cautions and caveats
In general, caution should be exercised when interpreting Indigenous suicide data, particularly trends over time and data for smaller geographic areas. Time series should be treated with caution as the numbers do not take into account population changes over time.
The maps presented on this page use data from the National Coronial Information System (NCIS). The data from the NCIS provide the best available picture of suicide in Australian states and territories, although there are difficulties in establishing conclusively the number of Indigenous suicides. This is because a significant number of suicides are classified as having an 'unknown' Indigenous origin. The suicide numbers used in these maps have, where applicable, been adjusted to account for cases with 'unknown' Indigenous status (see below for more details).
The under-identification of Indigenous suicide is of particular concern in Victoria and South Australia. Deaths with 'unknown' Indigenous status accounted for around 30% of suicide in Victoria and over 70% in South Australia from 2001 to 2012. The information provided in the maps for the geographic areas (Statistical Divisions) within these states may be too unreliable for general use and should be treated with extreme caution. Data for these 2 states have been included in an attempt to provide a complete picture of available suicide data across Australia.
Interpreting small area data
Given the data concerns outlined above, the maps on this page should be interpreted with caution. They are designed to highlight the distribution of Indigenous suicide across Australia and areas with relatively high Indigenous suicide numbers-and how these have changed in recent years.
The 4 maps show the number of Indigenous suicides in each Australian Statistical Division (region) in 3-year periods from 2001 to 2012.
Adjustments for 'unknown' Indigenous status
Cases with 'unknown' Indigenous status were apportioned to Indigenous and non-Indigenous on the basis of what is known about the ratio of Indigenous and non-Indigenous suicides in populations (at the relevant state level) where Indigenous status has been established. The available data suggest that there is not a substantial over-representation of Indigenous or non-Indigenous people in these 'unknown' Indigenous origin cases. As a result, adjusted numbers of Indigenous (and non-Indigenous) suicides have been produced on the assumption that the proportion of Indigenous suicide deaths is broadly similar in aggregations of cases with 'unknown' and known Indigenous status. The Northern Territory had no cases that were classified as of 'unknown' Indigenous origin over the period 2001-12 so adjusted rates were not necessary. For the other jurisdictions, the number of suicides with an 'unknown' Indigenous origin were apportioned to either the Indigenous or non-Indigenous totals using the ratio of those of known Indigenous status. To increase data fidelity, only data for years where the proportion of those with 'unknown' Indigenous origin was less than 50% were used to calculate the ratio-this was only applicable in South Australia (where the ratio was calculated using data for the years 2002 and 2011 only) and Victoria (using the data for 2000-2007 and 2010-2012).


